 Yesterday at Boot Camp Digital, we hosted a lunch & learn on Visual Social Marketing. The class primarily focused on Instagram for Business, as well as Infographics.
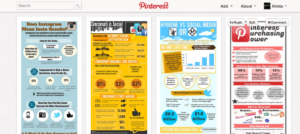
I was especially excited about the Infographics section of the class because, as most of you may have noticed, we’ve been creating tons of Infographics lately and we have been getting some great publicity from them. You can check them out right here on our Pinterest page. For those of you who don’t know what an Infographic is, it’s basically a visually appealing way to share information, statistics, and helpful tips. The picture to the left of our Infographics Pinterest board gives you a good idea of what they look like.
So right now you’re probably wondering “are Infographics right for my business?” Absolutely! I don’t care what you do, what service or product you sell, and who you’re marketing to. Whether you’re B2B or B2C, when it comes to social media you are always marketing to PEOPLE.
Besides the fact that an Infographic is a creative and visual way to tell a story, here are some other reasons for creating Infographics:
- You can share popular content
- You can use it to link back to your site (which helps your website’s Search Engine Optimization)
- It encourages Facebook engagement (Facebook users LOVE images)
- People will pin it on Pinterest
- It’s reusable content (you can post it again and again and again – as long as you allow some time to pass in between each posting)
So now that you’ve got PLENTY of good reasons to create an Infographic for your business, here are 5 easy steps to make it happen…
Step 1: Plan Your Theme
As I mentioned, Infographics are about telling a story visually. Think about your brand and what your business does, and plan out what relevant content you can share that will be interesting to people. For example, if you own a bakery, create an infographic about the perfect cupcake recipe, or tips for some delicious holiday treats.
Step 2: Research
Find statistics and information on the topic you’re covering. People love statistics, and they love feeling like they are getting instant value out of something. Your business is the expert on your product or service, so think about what information you can share with people that will be interesting and eye-opening.
Step 3: Create a Story
Now that you have a theme and the information to back it up, it’s time to tell your story. Think about how you’re going to organize the infographic – what information is going to go under what section? It’s all about making the information flow effortlessly.
Step 4: Express Visually
This step is easy – just build the Infographic! You’ve got a theme, research to back it up, and you know how you’re going to organize it. Now it’s just about picking interesting images and appealing colors. We use a software called Piktochart to create our images. It’s only $15 a month, and it’s a lot cheaper than paying a professional – which can cost upwards of $1,000!
Step 5: Promote it!!!
An Infographic is pretty useless if people don’t see it. Now’s the time to build awareness for your brand. We start our promotions by posting our Infographics on our blog, and linking to it on our main social media sites – Facebook, Twitter, and Pinterest. Remember: people love images so just make sure you are clear about what you’re sharing. You can also write a press release (with keywords in it about your Infographic) and then post it on free press release sites. Even if people don’t read the press releases, it will help your Infographic in Search Engines.
So there you have it – wasn’t as hard as you expected, right? Again, check out our Infographics Board on Pinterest for information. They are also scattered posts throughout our blog as well! If you need more in-depth training about Infographics, check out our popular Visual Social Marketing online training program!